Those of you who have been reading my blogs for a while know I’m a huge advocate of using visual elements to enhance my blog posts.
In addition to being visually appealing, images can actually improve the performance of your articles. That’s because blogs with pictures receive 94% more views than posts without them.
According to a recent study from the Content Marketing Institute, 73% of marketers say their top priority is to create more engaging content.
And 55% of these content creators are prioritizing visual content.
If you haven’t been using images to enhance your content, you should consider starting with some infographics. Even if you have included pictures in some of your old content, you can take this strategy to the next level by building custom infographics.
That’s because infographics are a combination of text and images. Research shows people follow directions 323% better if the directions include both text and illustrations.
On social media platforms, infographics get liked and shared at three times the rate of all other content.
Once you start building infographics, you will drive more traffic to your website. That’s because other people will use your custom images to enhance their own content.
As a result, you will consistently build backlinks, which will improve your SEO.
Now that you understand why you need to create infographics, it’s time for me to show you how. There are tons of tools available, but not all of them are created equal.
I’ve narrowed down the top 12 tools for building infographics.
1. Easel.ly
If you want to create an infographic fast and efficiently, Easel.ly is a great place to start.
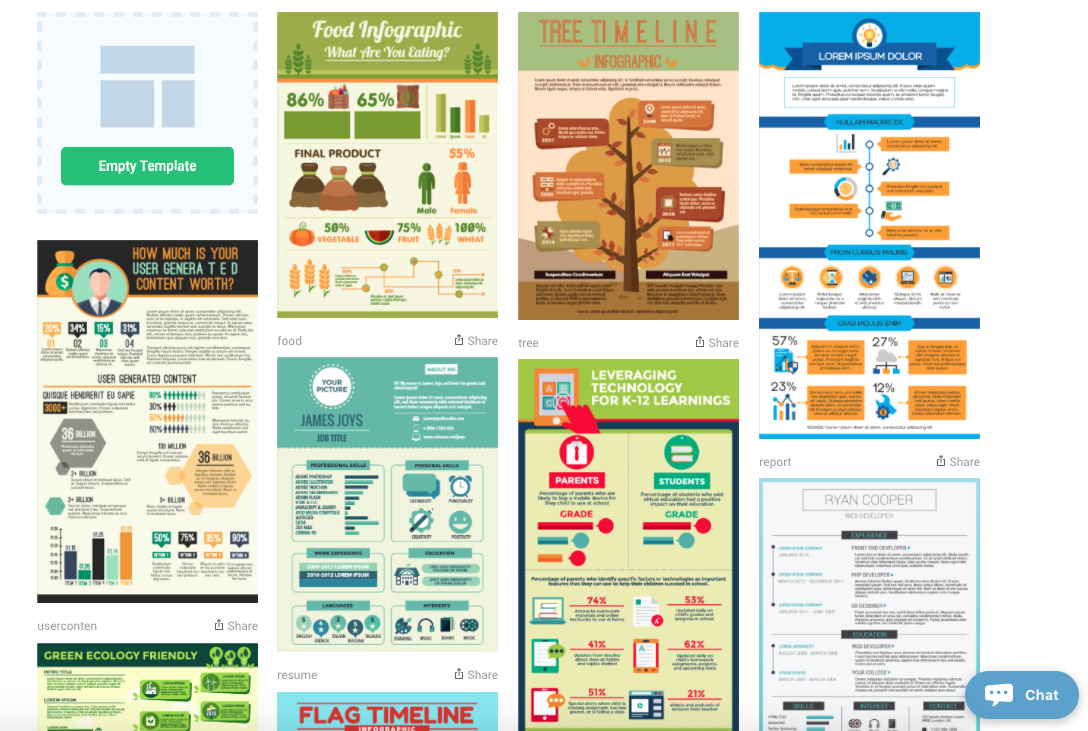
Above is a sampling of some of their top infographic templates. All you need to do is select the template you want and plug in your information.
They’ve got a template for everything. Some are designed to fit more text on the page, while others prioritize numbers from any research you may have conducted.
It’s free to use Easel.ly, but if you want premium templates, you can access over 500 of them for a fee. I recommend starting off with the free ones to see whether you’re happy with the platform before upgrading your membership.
Another cool feature of this platform is that they have community infographics built by others. You can plug your information into those as well.
The Easel.ly website features an easy to follow guide on how to create content on their platform. They also offer a live customer service chat option in case you have questions or run into any problems with the platform.
2. Pitkochart
Pitkochart is another top option for beginners. The platform makes it easy to create custom infographics without any design experience.
In addition to infographics, they have other design templates as well. You can build things such as:
- flyers
- posters
- presentations
- reports
Some of my favorite types of infographics on Pitkochart are the graphs. It’s a great way for you to display your numbers in a custom chart.
Pitkochart also has a map feature. You can customize the color options on these maps to show how different states, regions, or countries have varying results for your discussion.
Speaking of color options, Pitkochart has many. You can select colors for each portion of your infographic, or you can choose preset color schemes.
It’s an important feature because different color schemes can impact sales on your website.
They have a library of more than 1,000 icons. You can use these without having to pay licensing fees or give an attribution to the creator.
This definitely makes things less complicated, which allows you to spend your time and effort on building the infographics.
Once you build your infographic on Pitkochart, they help you name your image so that it’s optimized for SEO. Then, you can share it directly from the platform.
They have sharing options for email, ebooks, and social media. You can get an embedd link for your website, share it with your team, or download a high-resolution version of your infographic.
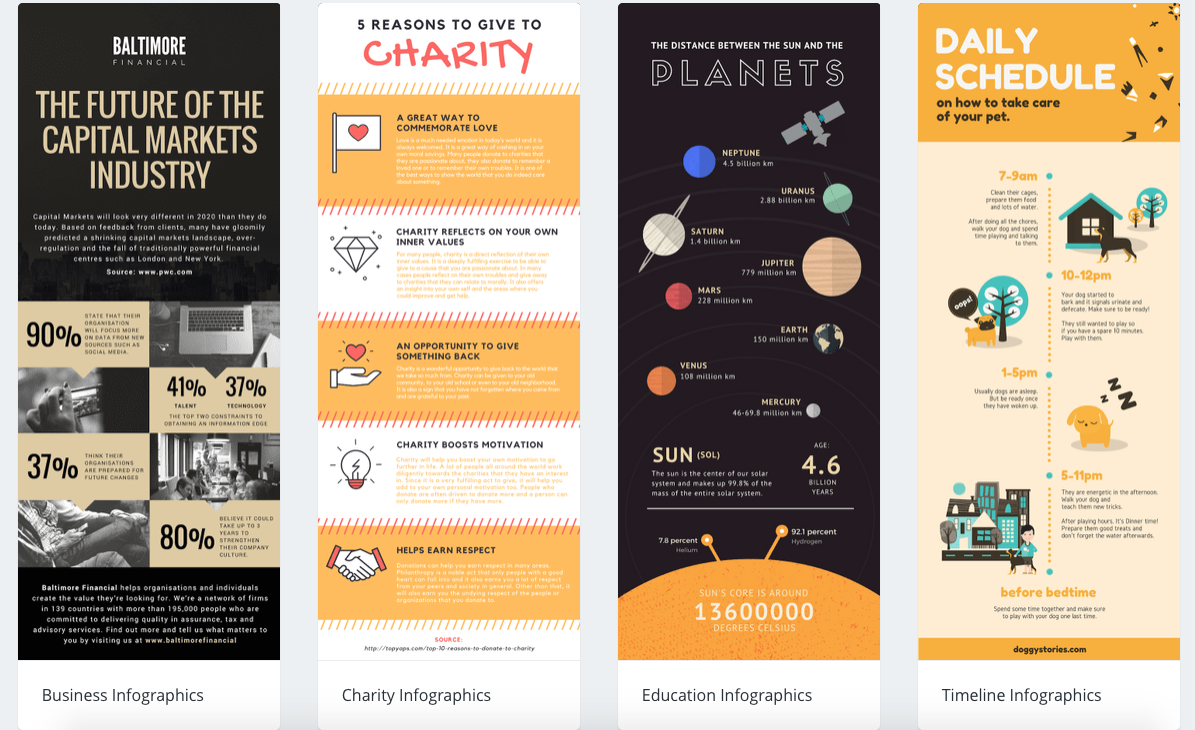
3. Venngage
Are you a student? If so, Venngage will let you use their software free. But everyone else will have to pay for the platform.
Their monthly rate is $19 for individuals and $49 for businesses. It may seem pricey, but the business membership comes with premium features such as:
- custom templates
- unlimited infographics
- 100 image uploads
- branding help
- charts
- icons
- team collaboration
- high-resolution downloads
If you know you want to take advantage of these features for the entire year, you can pay upfront annually and receive a 20% discount off your membership.
Venngage is great because their infographic templates are seemingly endless. With so many options, it’s less likely you’ll have similar to other infographics templates already published on the Internet.
This can make your brand stand out from the crowd.
They also group their infographics based on several categories. You can build the right image for whatever you’re trying to illustrate. Some of the top categories include:
- statistical
- lists
- timelines
- geographic
- real estate
- nonprofit
- human resources
They even have “fun data” templates to help you display your unique research in a way that’s easy to comprehend.
4. Visme.co
A list of visual design tools wouldn’t be complete without Visme.co. The platform specializes in all kinds of visual content, including infographics.
If you need to make an infographic that compares multiple variables, Visme.co has more than 20 charts and tables to choose from.
There are a couple of different ways you can input data into these visuals. Your first option is to type the numbers in manually. But if you have lots of information, you may prefer to import your data.
Another cool feature of these charts is the ability to connect with live data.
All of the templates have customizable fonts. You can change the color, size, and style of your text. Don’t see a font you like? No problem. Visme.co lets you upload your own fonts as well.
This software can help you take your infographics to the next level by making them more engaging. You can add video and audio files.
They also give you the option to embed polls, surveys, and maps. You can even add motion features, like popups, to your infographic.
Once your infographic is published, you can track how well it’s performing. The analytics tools tell you how many people saw your infographic, what type of device they used, their location, and level of engagement.
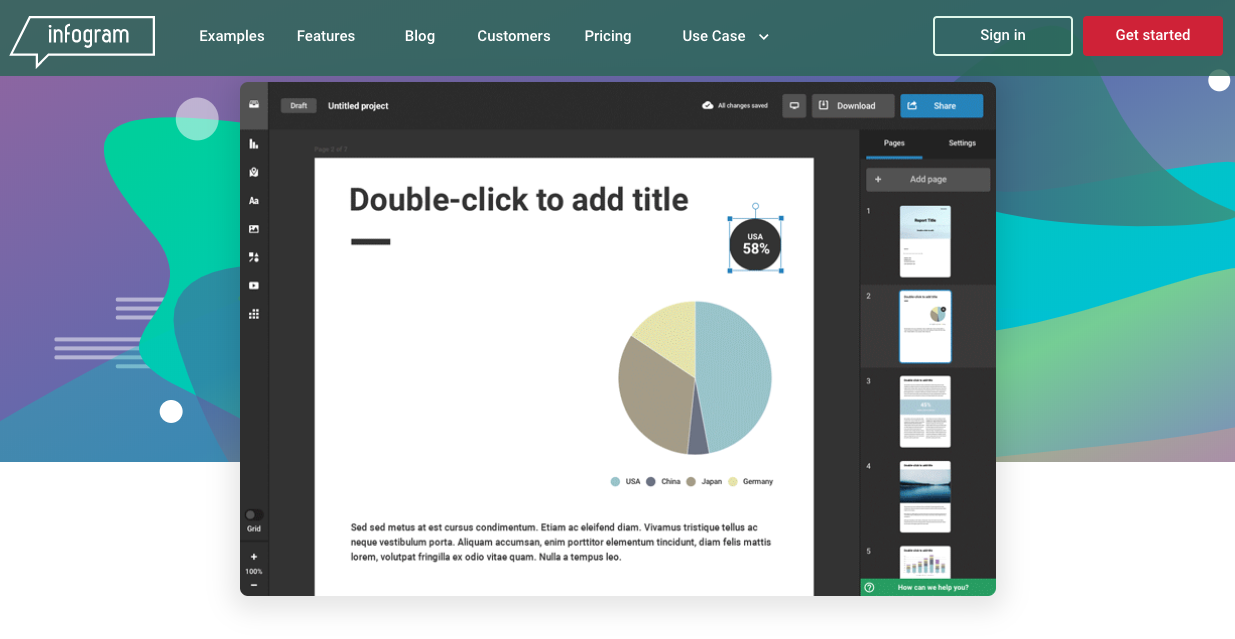
5. Infogram
Infogram is another one of my favorites. The platform allows you to fully customize every element of each infographic you create.
In addition to infographics, you can also use this software to create:
- reports
- charts
- maps
- dashboards
Infogram also helps you build images specially designed for your social media channels.
Their platform has more than one million icons and images, all royalty-free.
What I like most about Infogram is their editing tool. You can drag, drop, and move every element on the screen to fully customize your design.
If you have data that needs to be imported, it’s easy for you to upload spreadsheets from Excel, Google Drive, Dropbox, etc. You can even use a cloud service or their API to set up live data integration.
They have interactive charts and maps at your disposal as well.
Ultimately, if you need a one-stop shop for all your infographic needs, you can’t go wrong with Infogram.
6. Canva
Even if you don’t plan on making a ton of infographics, Canva has plenty of other design tools for you to take advantage of. Those of you who are a little bit more advanced will enjoy the graphic design features offered on this platform.
One of my favorite elements of the Canva platform is the versatility it offers. You can use it on the Internet as well as your iPhone or iPad.
They specialize in photo editor, color palette, and font combinations. But their infographic building tools are just as good, if not better. You don’t need to have a design background to figure it out.
Unlike some of the other Canva tools, the infographic builder is free to use. All you have to do is create a Canva account before you get to work.
Their library has more than one million photos, illustrations, and graphics for you to choose from. If you’re not happy with their selection, you can also upload your own images.
Once your image is uploaded, you can select a font from over 130 options. They make it easy for you to change the background and color scheme too.
After you’re satisfied with your custom layout, you can save these unique templates to your account. This makes it easy for you to repurpose the same layouts for your future infographics. It’s one of my favorite time-saving marketing tools.
If you’re not satisfied with all the elements in the free Canva library, they have premium elements available for purchase.
But unlike some of the more expensive infographic tools we’ve seen, the Canva premium purchases cost only $1 at most. It’s an extremely cost-effective way to enhance your infographics.
7. iCharts
If you want something a little bit different from the tools on our list so far, iCharts definitely fits the description.
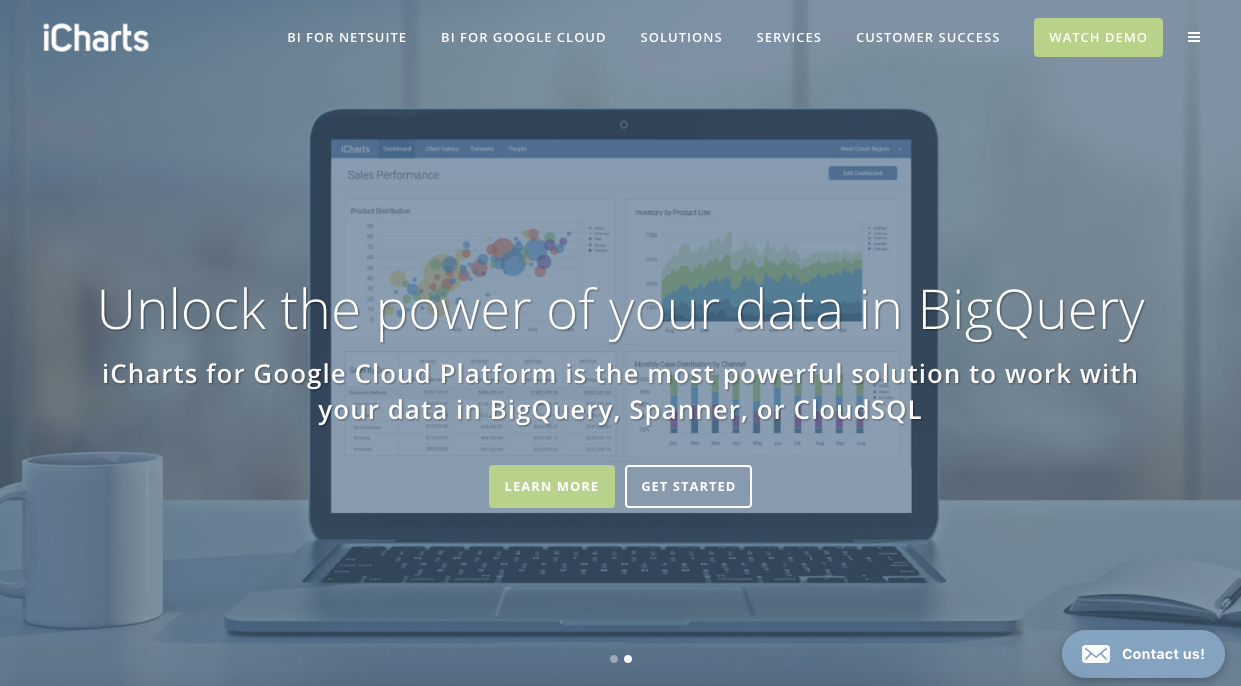
This platform is cloud-based. It’s a visual analytics tool allowing you to organize complicated business information.
You can use iCharts to simplify data from extensive research studies. Since it’s a cloud-based platform, you can access it from wherever you are. Nothing needs to be installed on a device.
They have a feature letting you implement real-time data integration.
This option isn’t a typical infographic builder. But you can still export the charts and graphs to enhance your content with custom images.
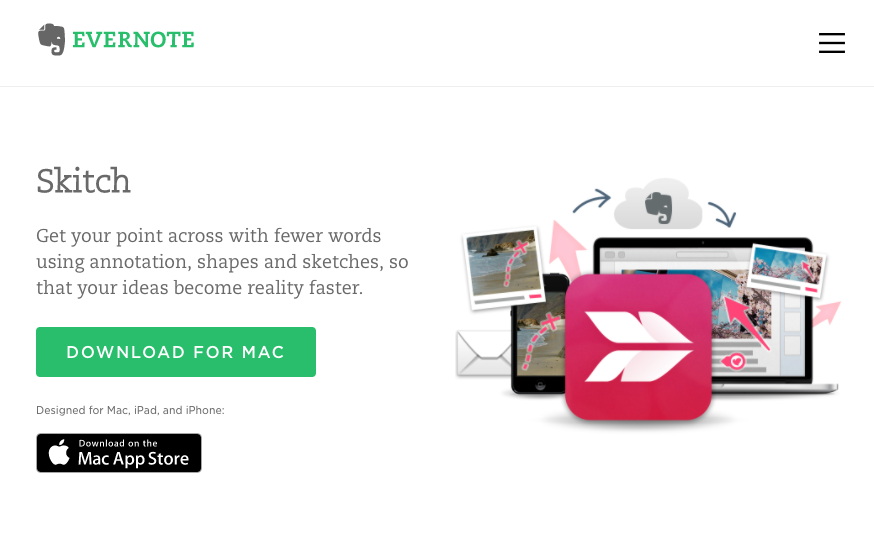
8. Skitch
Similar to our last tool, Skitch doesn’t necessarily build custom infographics either. But I use Skitch every day to help enhance my visual content.
Some of you may not be interested in building all your infographics from scratch. That’s OK.
If you’ve got a Mac, you can use Skitch to help you customize infographics from other sources. Here’s how you do it.
Once you download Skitch on your Apple device, which is free by the way, you can use it to take screenshots of infographics. Then you can markup specific sections with arrows, boxes, and text to make it your own.
Regular readers of my blog posts might recognize the pink arrows and annotations from Skitch. That’s what I use to mark up the images on my blog.
If you use this tool to help you build infographics, make sure you give proper credit to your image sources.
9. Creately
Creately is a platform specializing in creating unique diagrams for your business.
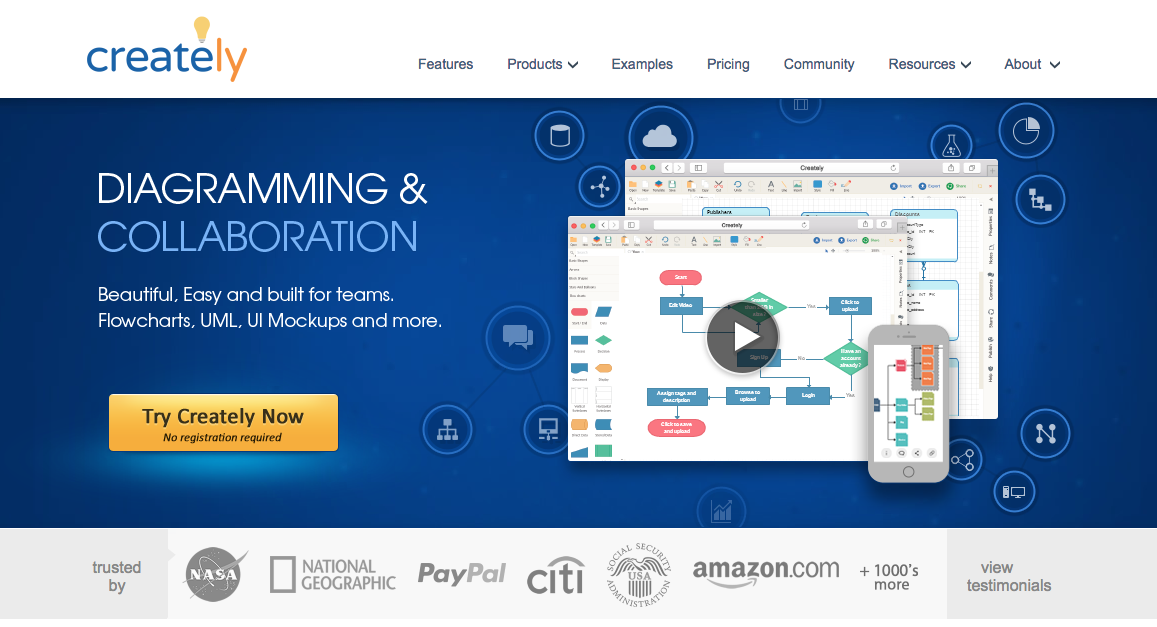
Although they aren’t exactly the same, diagrams and infographics are very similar, which is why I thought it was worth adding this tool to my list.
I recommend Creately for businesses that have multiple designers producing content at the same time.
With this software, you can collaborate with up to 20 team members on the same project with real-time updates, edits, and changes to your design.
They have over 1,000 diagrams for you to choose from. Even if you don’t want to publish your diagrams, you can use the tool for in-house projects such as building a customer journey map.
10. Google Charts
When in doubt, it’s always a good idea to use tools you’re familiar with. As a business owner, you’ve likely used Google Analytics to help you with your marketing solutions.
Well, Google Charts is another great option offered with your Google account.
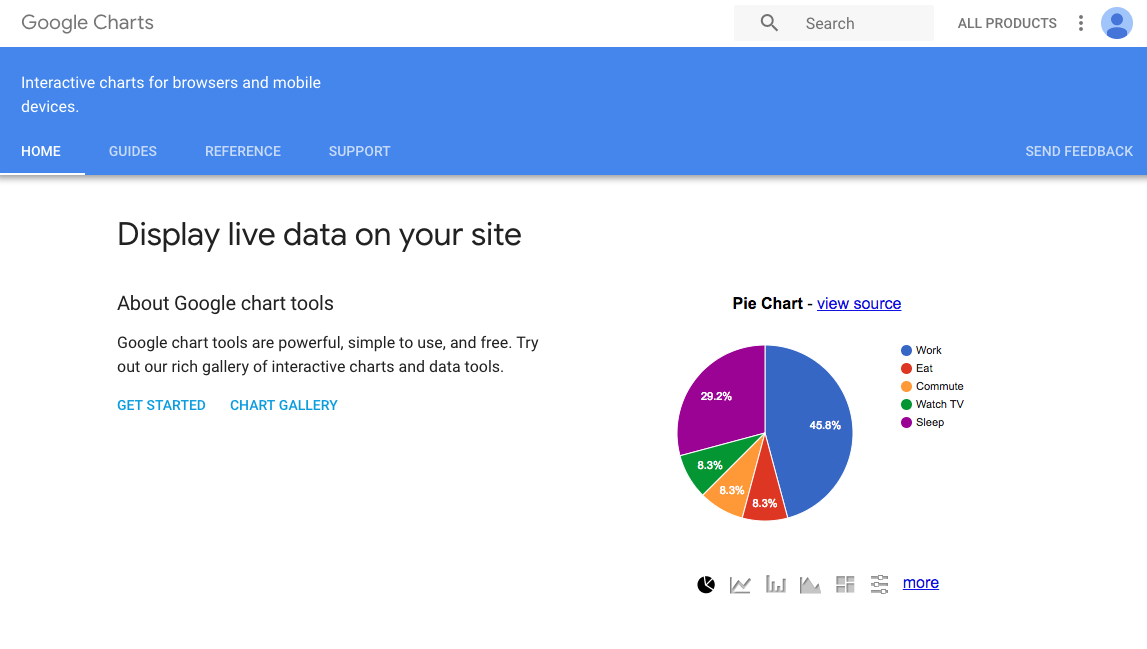
Once you determine which types of data sets you want to include, you can customize your design fully. You get to select which type of chart you want to use from Google’s extensive gallery.
It’s easy to add these infographics to your website, email messages, and social media channels.
Their dynamic data feature allows you to connect your data source so the charts updated with real-time information.
Google really stands apart from the crowd when it comes to customer service. There are thorough guides to help you with the tool. Every section has step-by-step, easy-to-follow instructions.
11. Gliffy
If you’re looking for another tool for creating custom diagrams, Gliffy is a great choice to consider.
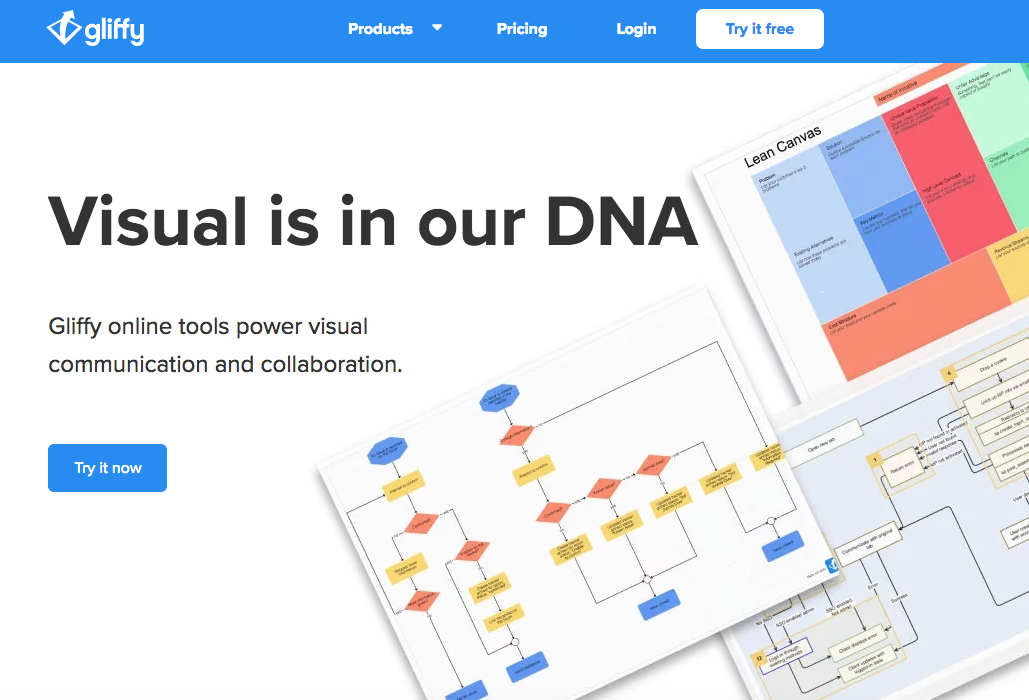
The software is extremely easy to use. You won’t need any type of design skills to build your infographics.
Everything is done with an HTML5 editor, so you don’t need to download anything to your devices in order to use this tool.
If you want to get your project done as fast as possible without building your own template, it’s no problem. Gliffy has ready-made templates. All you need to do is plug in your information.
Share your infographic with an embed link, or upload it directly to your social media profiles.
You can also use Gliffy to collaborate with your team members. Grant access to people whom you trust making edits to your design.
12. Wordle
Not every infographic needs to be a complicated set of data.
Sometimes, it’s effective to have only one statistic or sentence displayed to stand out from the rest of your content. If that’s the case, Wordle is one of your best options.
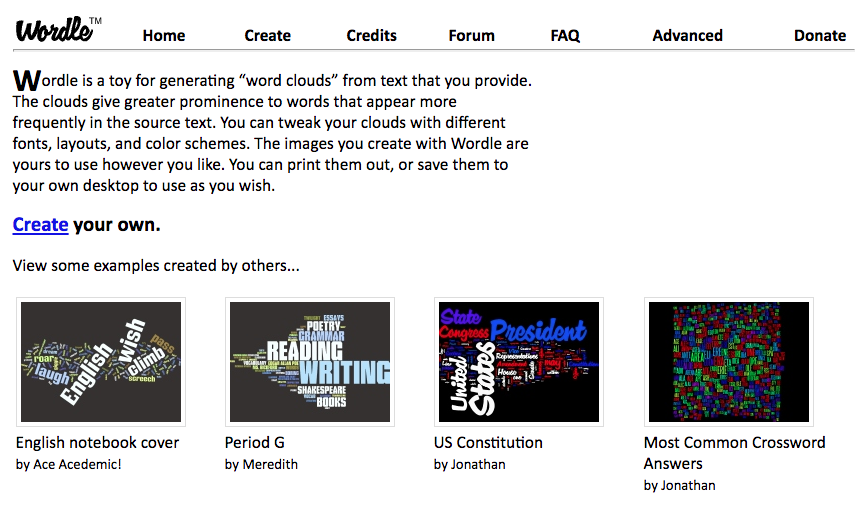
This platform is made for creating word clouds. You can use customized fonts and templates to create these unique images.
You can even use Wordle to reinforce a point you made within the text of one of your blog posts.
Conclusion
Images and visual elements are more powerful than words alone.
That’s why you need to be using infographics to enhance your content. But if you don’t want to search for infographics online, the tools I’ve outlined above allow you to create your own.
Don’t get me wrong: there are dozens of other infographic building tools available on the Internet. But from my experience, these ones are the best places for you to get started.
There’s something on this list for everyone—it just depends on what you’re looking for.
Some of these tools are free, while others charge a fee. Certain tools are better for charts and datasets, while others specialize in custom images and animations.
Refer to this guide for all your infographic creation needs.
What tools does your company use to enhance your visual content strategy with infographics?


No comments:
Post a Comment